I've lived in Northern Ireland for 17 years. You'd think that'd be enough time to learn where all 32 counties are. It is not.
So I built a quiz. Partly to fix that, partly as a design and development exercise. Small in scope, well-defined, the kind of project where you can actually finish the thing. The result is <map-quiz>: one JS file, no dependencies, three modes, and maps of Ireland, the US, and Europe.
The actual reason
Two things at once. The Irish county geography gap is real — I wanted to actually learn them, not just feel vaguely bad about not knowing them. And it's a good UX exercise: a constrained interface with a clear user goal, distinct interaction modes, accessibility to get right. Small enough to build without a team or a deadline, real enough to care about getting the details correct.
It also became a project about the technology itself. I wanted to understand what web components can do in 2026, without the ceremony of a framework. Shadow DOM, CSS custom properties, ::part() for theming, zero build tooling. The constraint was productive: if it couldn't be done in a plain <script> tag, it didn't belong here.
Ireland was the starting point. Once the architecture was there — SVG paths, JSON data, three modes — the component didn't know what geography it was displaying. Adding the US and Europe was a matter of running the GeoJSON converter and pointing it at the result. Europe came along mostly because the projection work was already done.
What it does
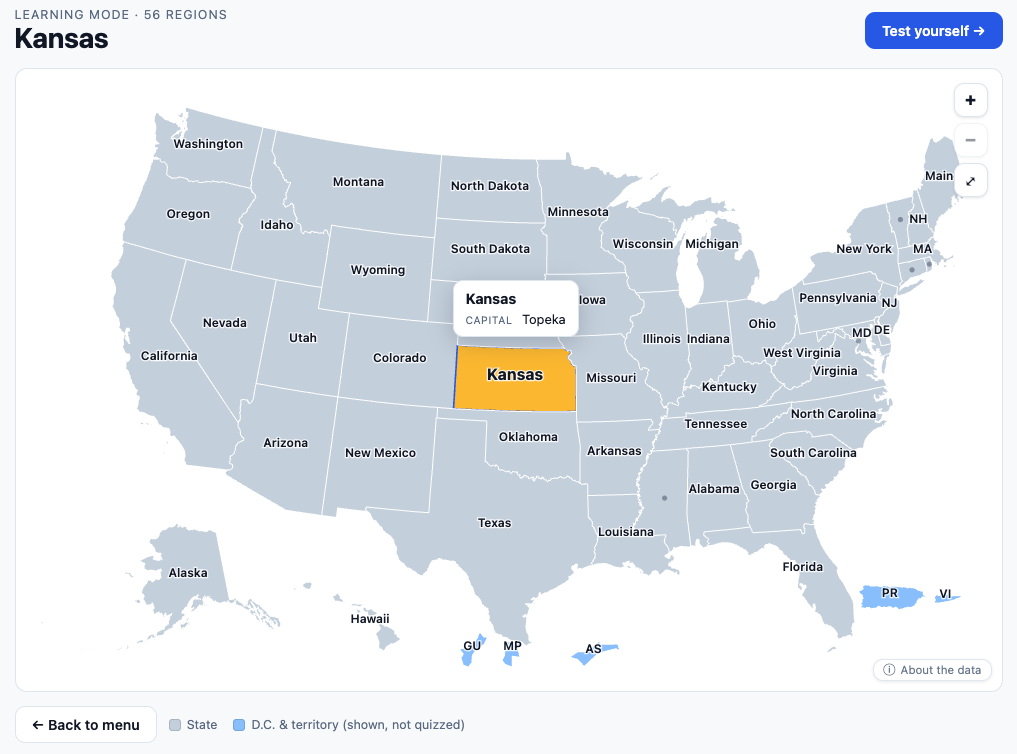
Three modes. Learn the map labels every region and lets you hover or tap to focus; click to pin a callout with the region's name and capital (or county town). Find it on the map names a region and you click the right one on the map. Name the region highlights a region and you pick its name from a shrinking list of everything left to guess.
The quiz modes track first-try accuracy, total misses, and time, with a results screen at the end. Both are honest about when you go wrong.
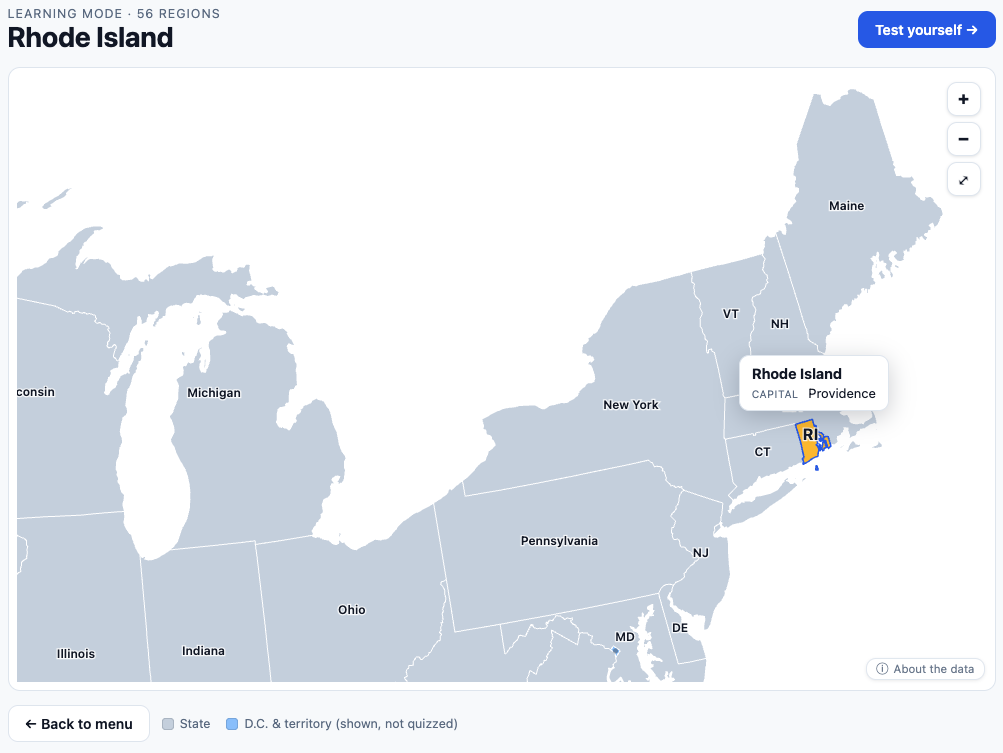
The map is zoomable and pannable throughout, which matters more than it sounds. The northeastern US states are genuinely tiny at full view — being able to hold ⌘ and scroll into the corner where Rhode Island, Connecticut, and Massachusetts are competing for the same pixels is what makes those modes actually playable. Regular scrolling passes straight through to the page; the component only intercepts scroll when you're holding the modifier key.
For the US and Europe quizzes, Learn mode shows more than the quiz tests. D.C. and the five inhabited territories are shown and labelled in Learn mode but left out of the quiz — same for the six European microstates (Monaco, San Marino, and the rest, which are sub-pixel at map scale and rendered as positioned markers rather than outlines). They show up differently, with a legend, so it's clear what's quizzed and what's just context.
If you point the component at a manifest file, it shows a quiz picker. Point it at a single quiz file and it skips to the mode picker. Either way, everything's self-contained.
How it's built
One JS file, no import/export, no build step — it works from a <script> tag or a module, dropped directly into any page. The map is SVG: each region is a <path> whose geometry is already projected into the viewBox coordinate space in the data file. Labels sit at precalculated coordinates, stay a constant size as you zoom (so zooming into a crowded area reveals labels rather than ballooning them), and collapse to a dot on small regions where the full name won't fit at the default zoom level.
Quiz data is JSON: a viewBox, a prompt string, and a regions array where each entry has an SVG path, label coordinates, an optional capital for the Learn-mode callout, and an optional category field to mark context-only regions. Adding a new quiz means converting a GeoJSON file with the bundled tool and pointing the component at the result — nothing in the component knows anything about Ireland or the US specifically.
Theming goes through CSS custom properties for colors, radius, and font stack, plus ::part() selectors for element-level overrides. Shadow DOM means the component's styles don't leak out and your page styles don't leak in — which makes it genuinely embeddable without worrying about cascade conflicts.
The Ireland data took a bit of work to get right. The Republic's counties come from GADM boundaries; Northern Ireland's six historic counties had to be reconstructed by dissolving district boundaries from a different dataset. The internal lines near Belfast are slightly approximate as a result, but the county set, outlines, and overall shapes are correct.
Building it with Claude
Same approach as the Figma plugin: I used Claude through the Cowork desktop app as the development partner throughout the build. Vanilla JS, built iteratively, each session picking up from the last.
The SVG pan/zoom implementation and the projection work for the US insets (Alaska and Hawaii in the Albers USA projection, the territories placed as separate insets) were the parts I was least confident about tackling on my own. Both came together well.
What's interesting about building something like this with Claude versus a typical design-systems tool is how much the constraint-articulation matters. With the Figma plugin, I was describing UI behavior — what happens when you click, what the preview should look like. With this, I was describing spatial and mathematical constraints: how should the map stay centered on the cursor while zooming, when should the pan bounds clamp, should labels scale with zoom or hold a constant size. Having to answer those questions precisely, rather than leaving them for later, meant the decisions were made before they could become bugs.
Where it stands
It's live in the lab — try it here. The three bundled quizzes are working. I now know where Wexford is.
What's rougher: touch zoom could be smoother, and the Name mode answer list gets long with larger quizzes. Whether those get fixed depends on whether I keep using it, which is honestly the best test for whether a personal project was worth building at all.
For now, it works. That's enough.